m3resp.visualization.plot_session_overview#
- m3resp.visualization.plot_session_overview(session, *, max_seconds=120.0, emg_channel=None, eit_waveform='global_impedance_(raw)', backend='matplotlib', max_points=5000)[source]#
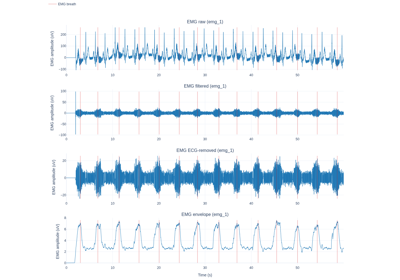
Plot the loaded EIT signal and the processed EMG signals of a session.
Each signal gets its own panel. Green lines mark the EIT breaths and red lines mark the EMG breaths, at the extremum of each breath.
- Parameters:
session (M3Session) – The session with the loaded EIT data, the processed EMG data, or both.
max_seconds (float | None) – Show the first
max_secondsseconds of each signal.Noneshows the full signal.emg_channel (int | None) – The EMG channel to show. It must be the channel that the EMG processing used.
Noneshows that channel.eit_waveform (str) – The name of the EIT signal in the first panel.
backend (str) –
"matplotlib"gives a static figure."plotly"gives an interactive figure for a web page or a notebook.max_points (int | None) – For
backend="plotly"only. The largest number of points drawn for one signal. A longer signal keeps the lowest and the highest value of each short time bin, so the peaks stay visible.Nonedraws every sample.
- Returns:
The figure.
- Return type:
- Raises:
ValueError – If
backendis unknown, if the session has no signal to plot, or ifemg_channelis not the processed channel.ImportError – If the plot library of
backendis not installed.