m3resp.visualization.plot_eit_processing_summary#
- m3resp.visualization.plot_eit_processing_summary(session, *, backend='matplotlib', max_points=5000)[source]#
Plot the results of the EIT processing of a session.
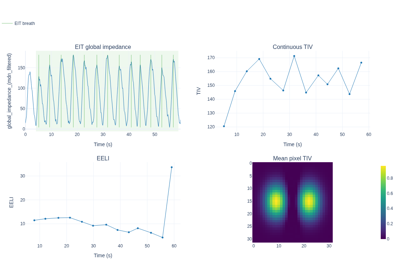
The four panels show the global impedance with the EIT breaths, the TIV and the EELI of each breath, and the mean TIV of each pixel.
- Parameters:
session (M3Session) – The session after the EIT processing.
backend (str) –
"matplotlib"gives a static figure."plotly"gives an interactive figure for a web page or a notebook.max_points (int | None) – For
backend="plotly"only. The largest number of points drawn for the global impedance. Seeplot_session_overview().
- Returns:
The figure.
- Return type:
- Raises:
TypeError – If the session has no processed EIT data.
ValueError – If
backendis unknown, or if the processed EIT data has no global impedance.ImportError – If the plot library of
backendis not installed.